
SimulIDE Knowledge Base
– INFO PANEL –
Simulation Info panel is located at the bottom part of the central widget, just below Circuit canvas and besides Message panel.
Here you can see some basic information about how the simulation is performing:
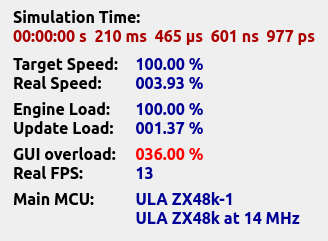
- Simulation Time: time of the simulation.
- Target Speed: speed configured in Simulation settings.
- Real Speed: actual speed of the simulation.
If 100% then the simulation is running at real time.
If lower that target speed then your computer can’t keep the desired speed. - Engine Load: how much load is in the simulation engine. Below 100% means that the engine still not reached maximum capacity.
- Update Load: load in the update step. This is usually very low. If it is high, it can indicate some problem.
- GUI overload: This is usually hidden, it only shows up when the GUI thread is overloaded (can’t keep with the simulation speed).
- Real FPS: update rate of the GUI thread. If it is lower than configured in Circuit settings “GUI overload” will appear.
- Main MCU: brief information about the “Main MCU” in the circuit (the one with the yellow dot).