SimulIDE Knowledge Base – DEBUGGER
It is posible to debug many types of source codes in SimulIDE.
For that, the proper Compiler should be configured and selected.
Sections:
Related topics:
Starting debugger:
When your code can be compiled and uploaded without errors you can start a debugging session by clicking the debug button: 
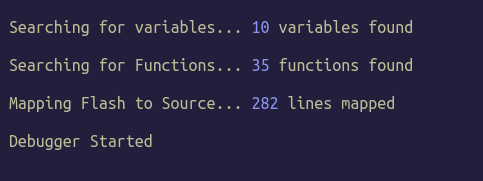
If everything is ok you will see a message similar to this at the bottom panel:
The tool bar will change to debugger mode and an arrow icon will point to the first line of code:

Debugger actions:
Step: step to next line.
Step Over: step over function calls.
Run to Breakpoint: run until next breakpoint.
Pause: pause if running.
Reset: restart debugger.
Stop: stop debugger.
Breakpoints:
You will notice that all lines that have been mapped are marked in dark green in the line number area:
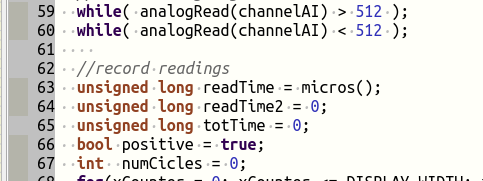
These are the “active” lines, where the debugger will step and where you can place breakpoints.
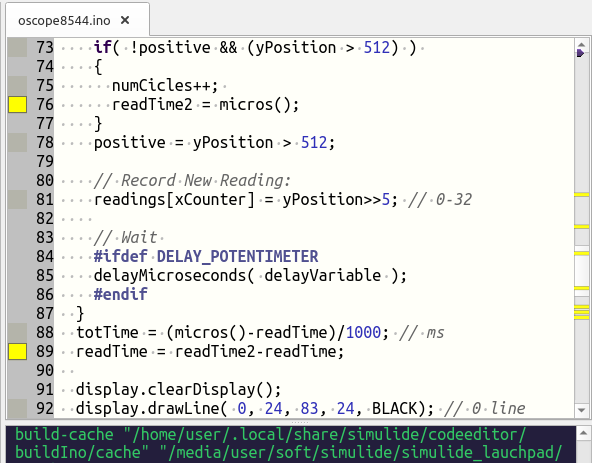
You cann add or remove a breakpoints just by clicking in the line number area or by right-click and select action:

Breakpoints appear as yellow squares in the line number area.
And yellow indicators for all breakpoints will apeear in the scroll bar:
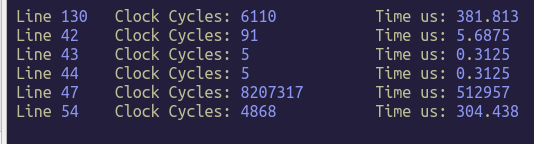
Message Panel
This Message panel below the Editor view shows some information about the execution of each debugging step :
- Source code line. - Clock cycles that took to execute the step. - Time that took to execute the step in microseconds.